Calculate cosine similarity
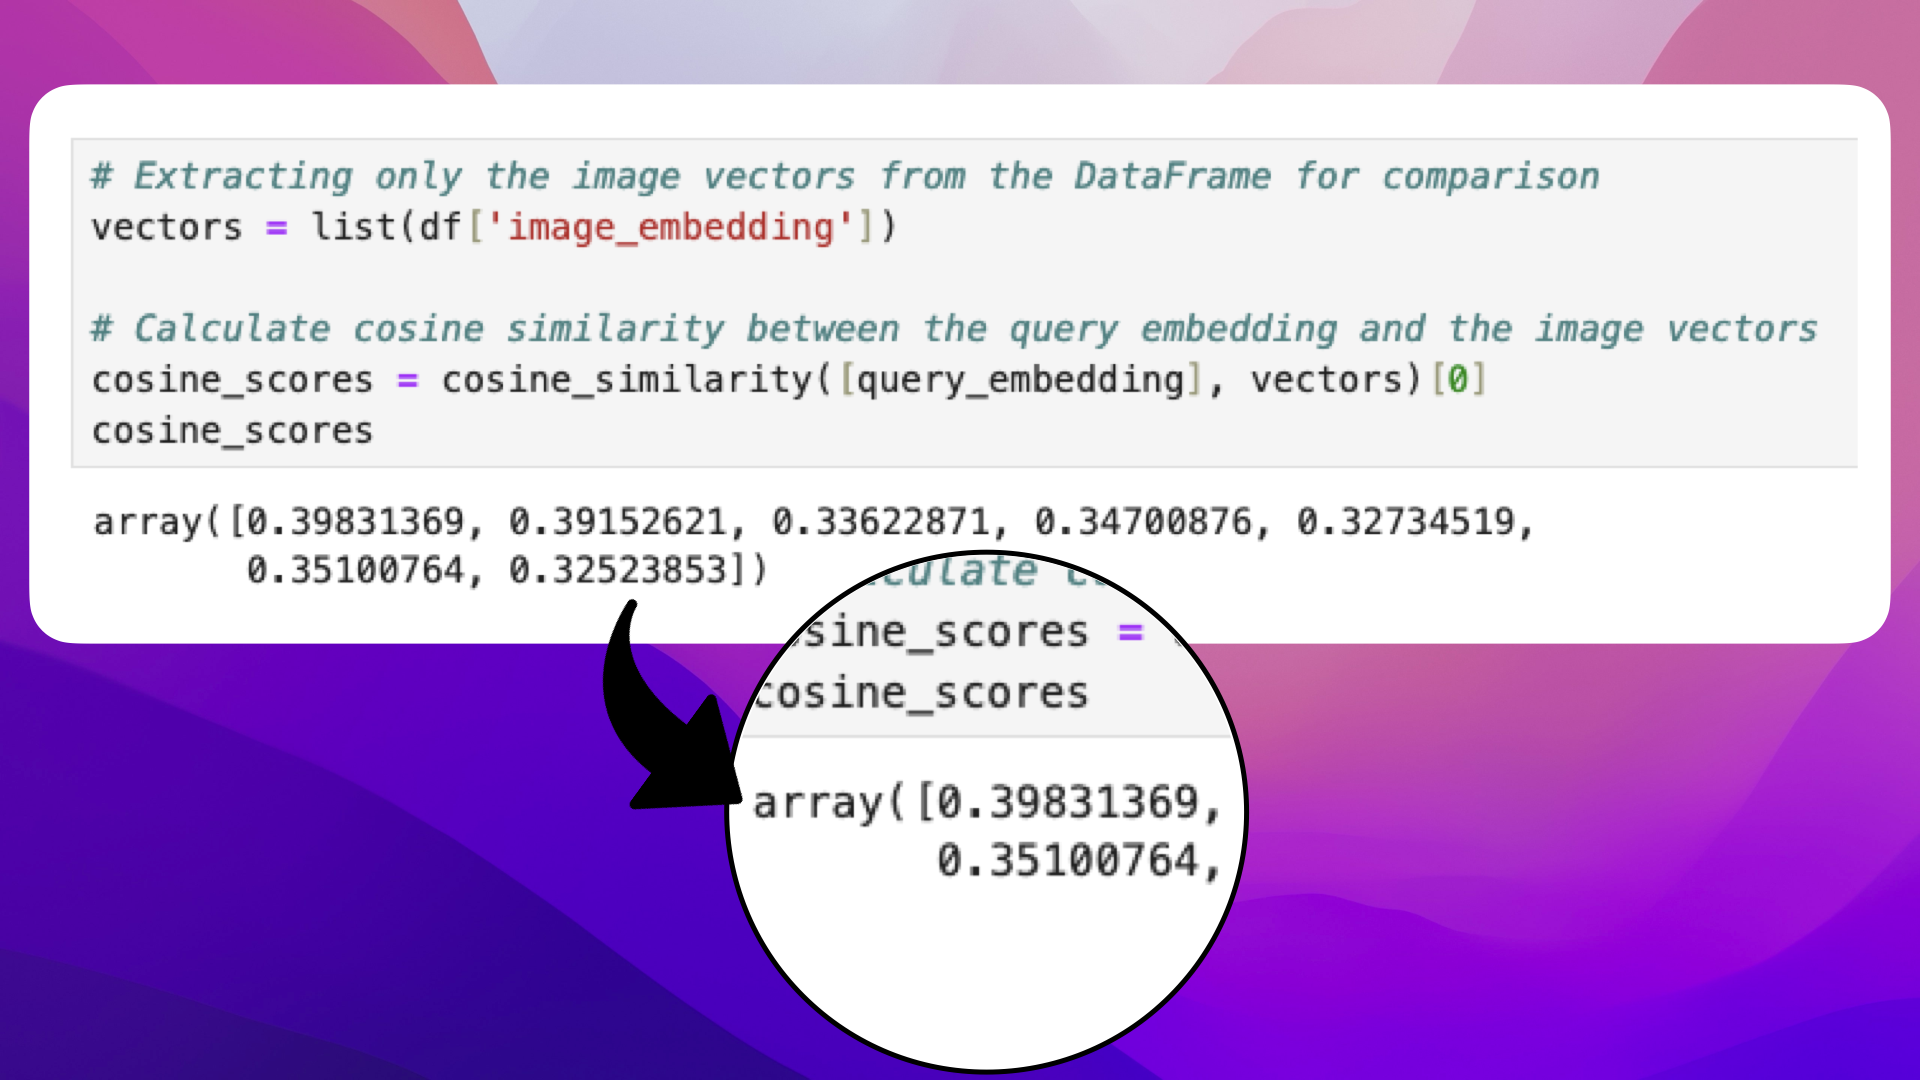
Next, prepare to compare the customer query embedding with our product embeddings. Start by gathering the embeddings from your product catalog into a list:
# Extracting only the image vectors from the DataFrame for comparison
vectors = list(df['image_embedding'])
Then, calculate the cosine similarity between the customer's query embedding and each product's image vector using sklearn's cosine_similarity function:
# Calculate cosine similarity between the query embedding and the image vectors
cosine_scores = cosine_similarity([query_embedding], vectors)[0]
cosine_scores is now a list of the scores of how similar each bag is to the customer query Hi! I'm looking for a red bag:

This process produces a list of scores indicating the similarity between the customer's query and each product.
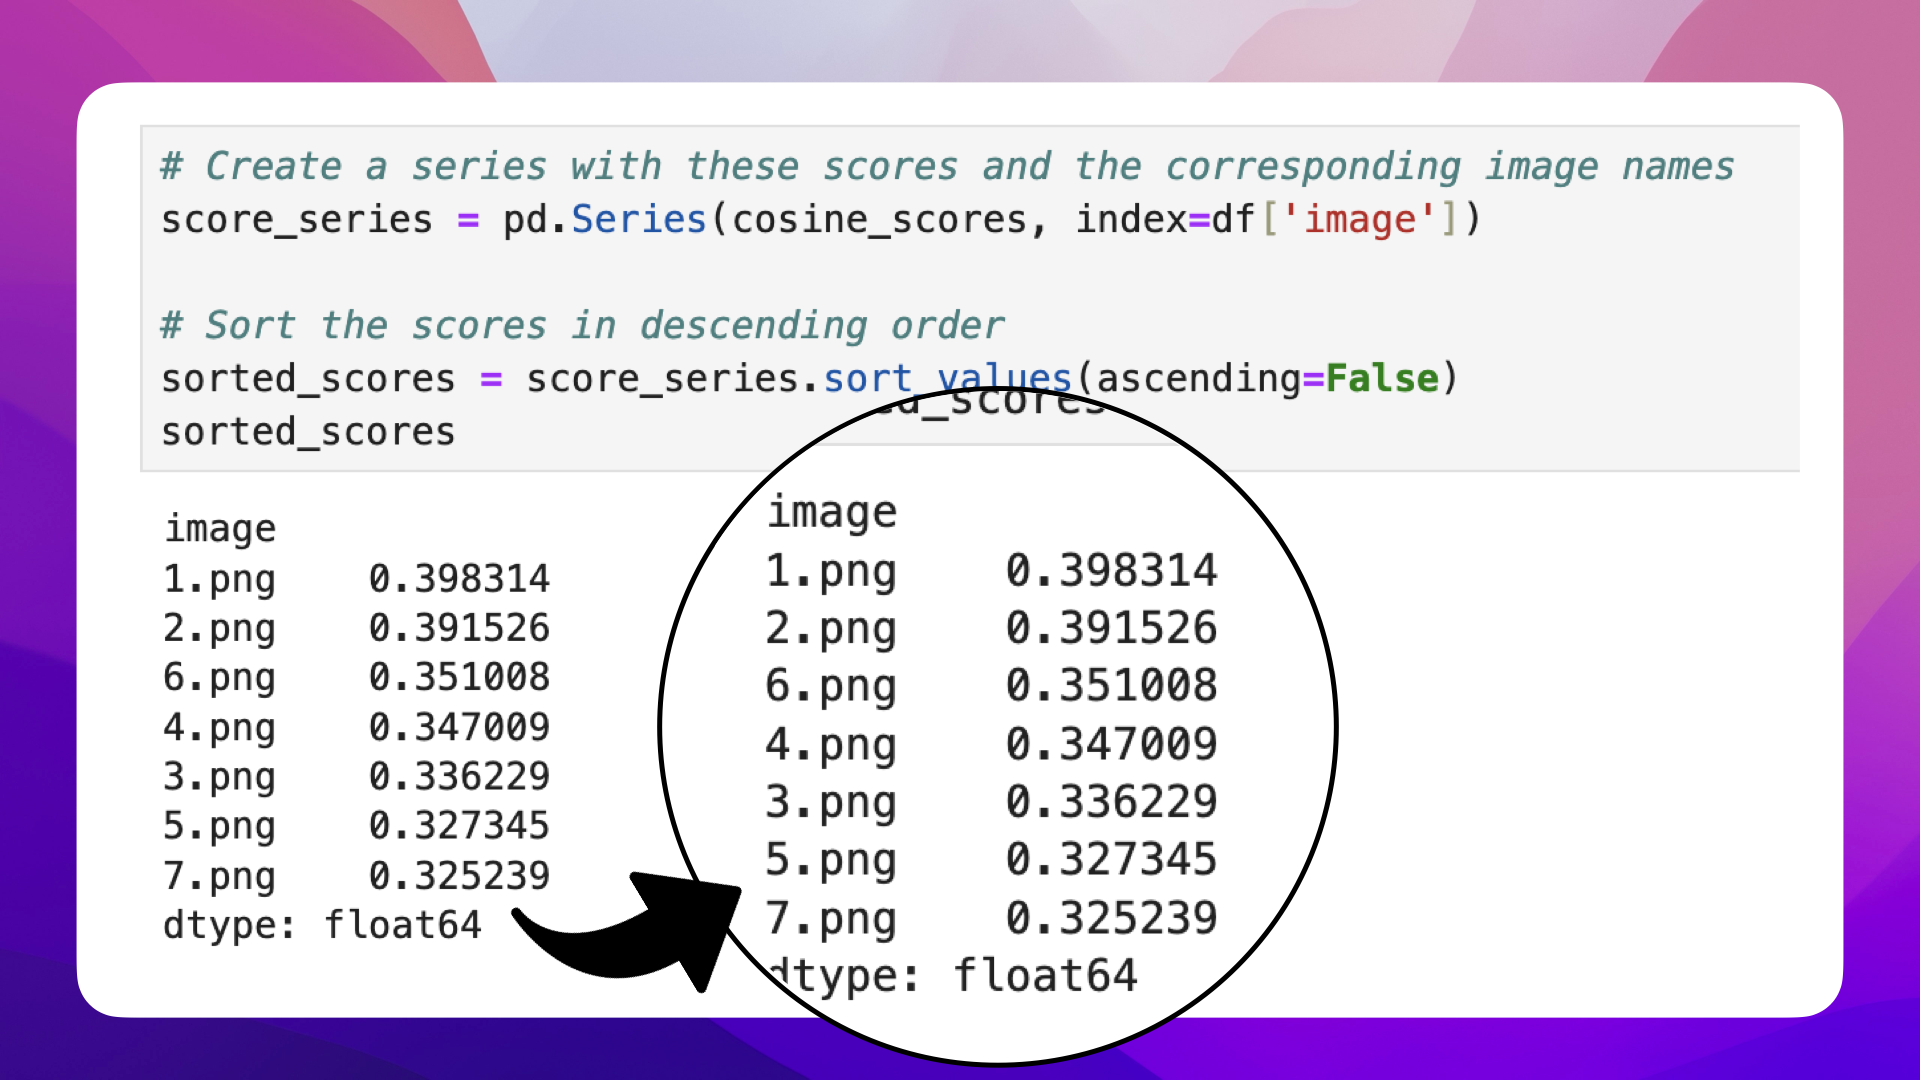
To link these scores with the corresponding products, create a Pandas series mapping scores to product images:
# Create a series with these scores and the corresponding IDs or Image names
score_series = pd.Series(cosine_scores, index=df['image'])
Finally, let's sort the product scores in descending order, starting with the most fitting product suggestion for the customer query Hi! I'm looking for a red bag:
# Sort the scores in descending order
sorted_scores = score_series.sort_values(ascending=False)
sorted_scores
The sorted_scores should look something like this:

Now that we have the similarity scores, let's write a code snippet to display the products in the next section.